 MASSIV
FREE TOOL
1RM Calculator
Enter a set you actually hit — the weight and how many reps you got — and see your estimated one rep max, plus what every other rep range should feel like.
Use a real set, not a guess. Estimates are most accurate from a hard set of 1–6 reps taken close to failure. Past 10 reps, treat the number as a ballpark.
Your rep maxes
Derived from the same formulas, in reverse.
| Reps | Weight | % of 1RM |
|---|
MASSIV TRACKS THIS FOR YOU
Your 1RM shouldn't be something you calculate by hand.
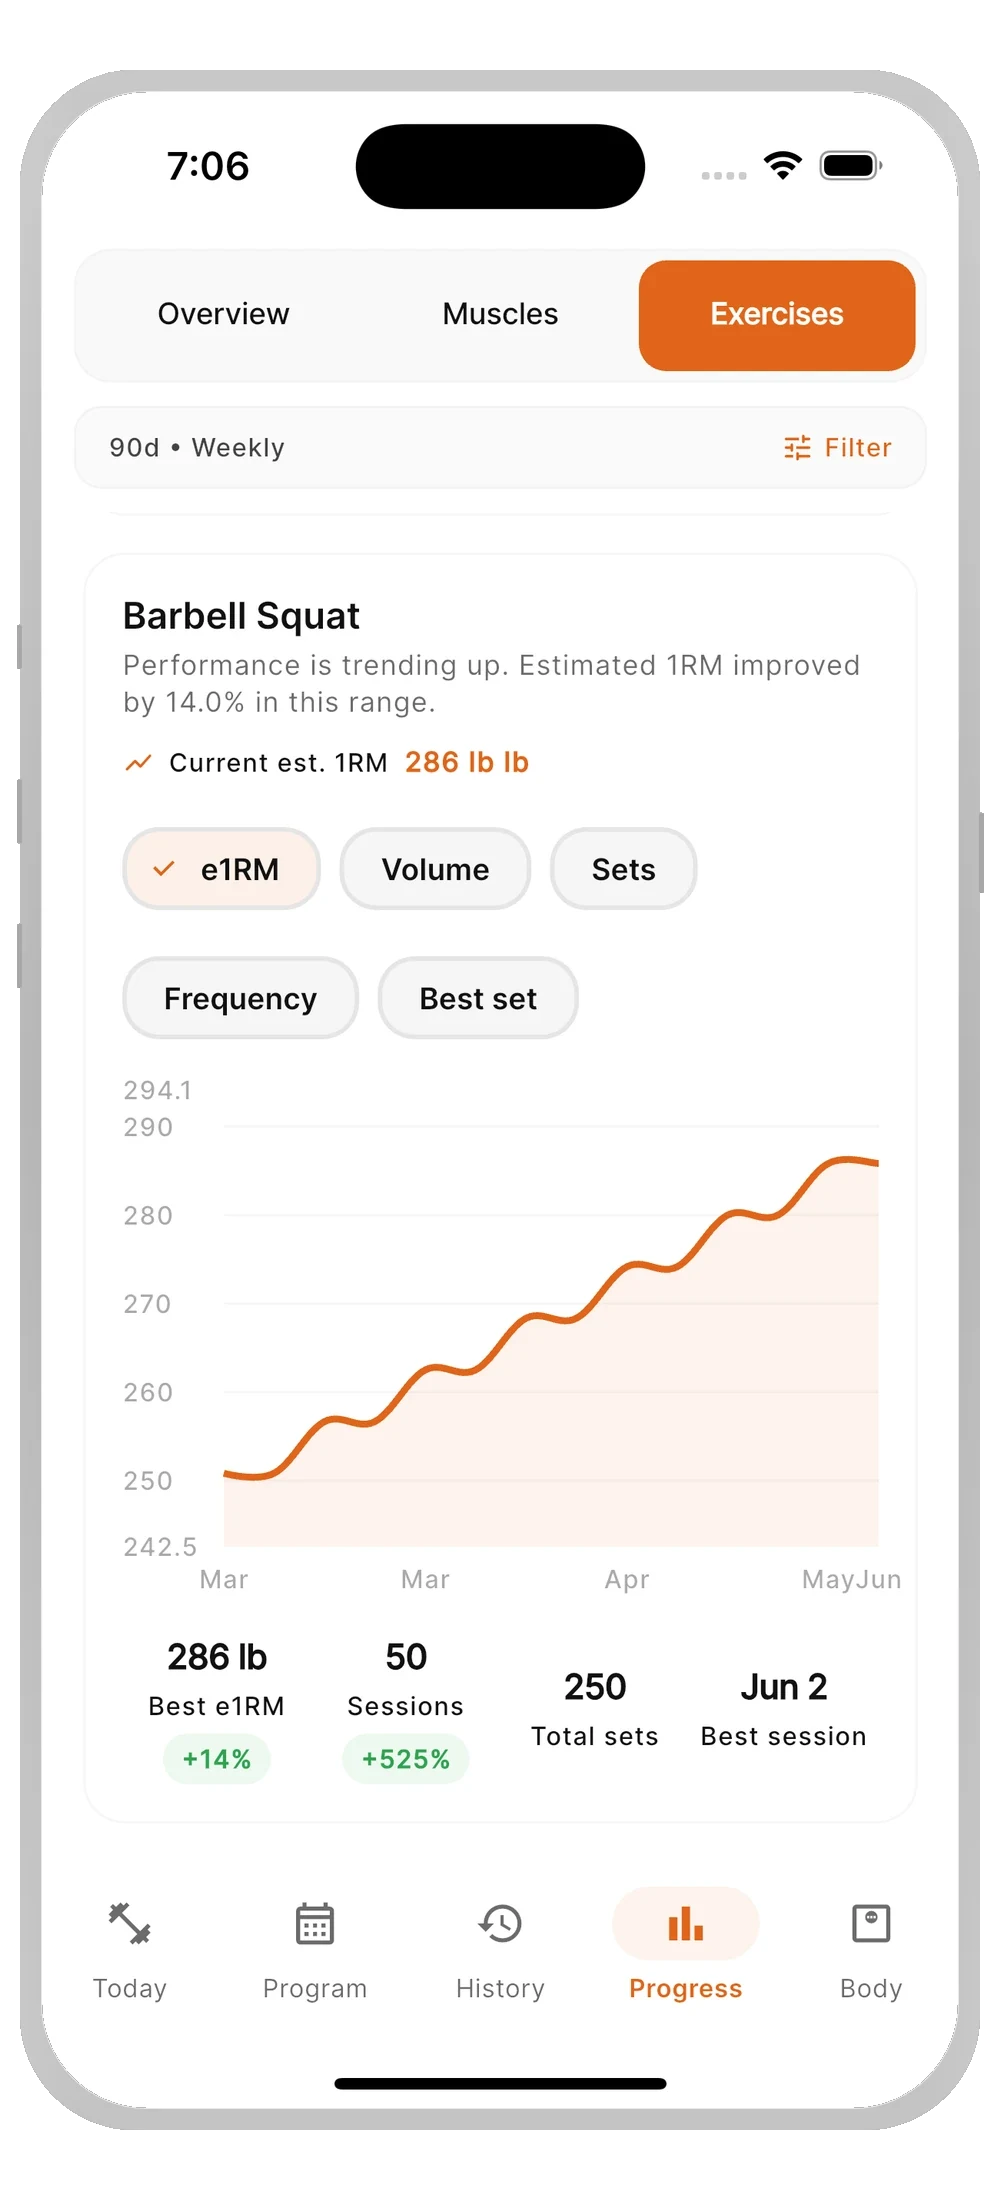
Massiv estimates your e1RM from every working set you log, smooths it across sessions, and uses it to set the weights on your next workout — then tells you why it changed.


How to calculate your one rep max
A one-rep-max calculator estimates the heaviest single you could lift from a set you already did. You take a hard set — say 225 lb for 5 reps — and run it through a formula that scales the weight up based on how many reps you managed. The fewer the reps, the more accurate the estimate.
You don't need to actually test a true max. For most lifters, testing a genuine 1RM is a bad trade: it costs a session, adds fatigue, and carries a real injury risk on squats and deadlifts. An estimate from a set of 3–5 is close enough to program with, which is exactly what percentage-based programs like 5/3/1 assume.
The three formulas, and when each one is right
Most calculators use one formula for everything. That's where the error creeps in — a curve that fits a heavy triple badly overestimates a set of twelve. Massiv picks the formula by rep range:
- Epley —
weight × (1 + reps ÷ 30). Best validated at low reps. Used for 2–6 reps. - Brzycki —
weight × 36 ÷ (37 − reps). More conservative in the middle. Used for 7–10 reps. - Lombardi —
weight × reps^0.10. Holds up in hypertrophy ranges where the others run away. Used for 11+ reps.
There's a neat detail at the handover: Epley at 6 reps and Brzycki at 7 reps both land on 83.3% of the max, so the curve is continuous exactly where the formulas swap. The calculator above shows all three values at once, so you can see the spread rather than trusting a single number.
Note that these formulas are pure multipliers on the weight, so the estimate is unit-agnostic — kg and lb give the same answer with no conversion step.
Rep max percentage chart
The standard percentage table, derived from the same formulas. If your 1RM is 225 lb:
| Reps | % of 1RM | Weight (225 lb max) |
|---|---|---|
| 1 | 100% | 225 lb |
| 2 | 94% | 211 lb |
| 3 | 91% | 205 lb |
| 4 | 88% | 199 lb |
| 5 | 86% | 193 lb |
| 6 | 83% | 188 lb |
| 7 | 83% | 188 lb |
| 8 | 81% | 181 lb |
| 9 | 78% | 175 lb |
| 10 | 75% | 169 lb |
Where 1RM estimates break down
An estimate is only as good as the set behind it. Three things throw it off:
- Reps left in the tank. If you stopped at 5 but had 3 more, the estimate is low. Formulas assume the set was close to failure.
- High rep counts. Above 10 reps, endurance and technique breakdown matter more than raw strength, and every formula drifts.
- Exercise choice. These formulas were built around big barbell lifts. A 15-rep lateral raise "1RM" is not a meaningful number.
This is also why a single-session estimate is noisy. Massiv uses a rolling e1RM — the median of your best estimate per session across the last four training days — so one great day or one bad one doesn't move your programmed weights.